July 2026
In the late 1990s, online cartography services such as MapQuest or Yahoo! Maps provided maps as small, static GIF files. You clicked an arrow, waited, and a new pane appeared: jagged roads, plain colors, bitmap labels, and fixed zoom steps.
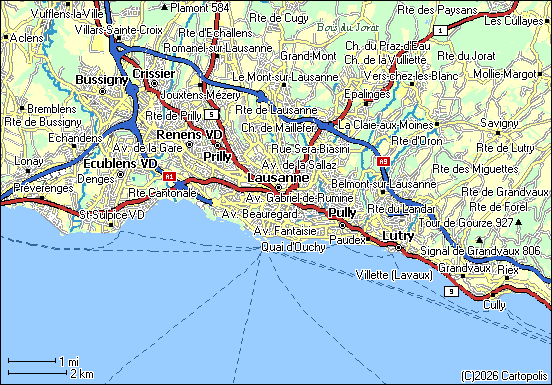
Cartopolis brings that visual language to present-day OpenStreetMap data, without emulating MapQuest or any other original software. It is a modern static website that draws today's maps as they could have been served to Netscape Navigator.
Even the name is period dressing: Cartopolis could have been an actual mapping service of the era, somewhere between eAtlas and CyberMaps. The result can be exported as a GIF89a using the classic 216-color web-safe palette.
Live: seriot.ch/cartopolis — the whole of Switzerland as static files.
The easy way to fake this look is a beige palette and a pixelation filter. Cartopolis does neither. The style is not applied afterwards. Instead, it emerges from the pipeline the way grain emerges from film. The renderer enforces a handful of deliberately chosen rules, and the look follows on its own:
Plus a few period props: hand-drawn 17 px shields, a red star marker, and a 1 px border.
Today's OpenStreetMap contains far more detail than a late-1990s web map could display, so the geometry is cut until curves become short, jagged polylines.
The result is crisp and high-contrast — a look that feels almost novel now that design tendencies point the opposite way, toward soft gradients, translucency, and muted low-contrast palettes.
Stefan Marti saved MapQuest maps of his hometown in 1999 and still hosts them today. Below is his map of Trimbach, Solothurn, side by side with Cartopolis centered on the same location and rendered at the same horizontal scale, about 4 meters per pixel. The red star marks the same spot in both panes. Click either map for full resolution.
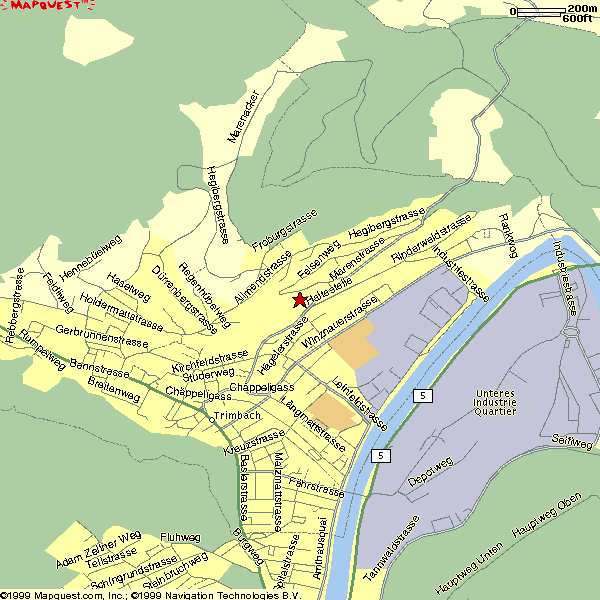
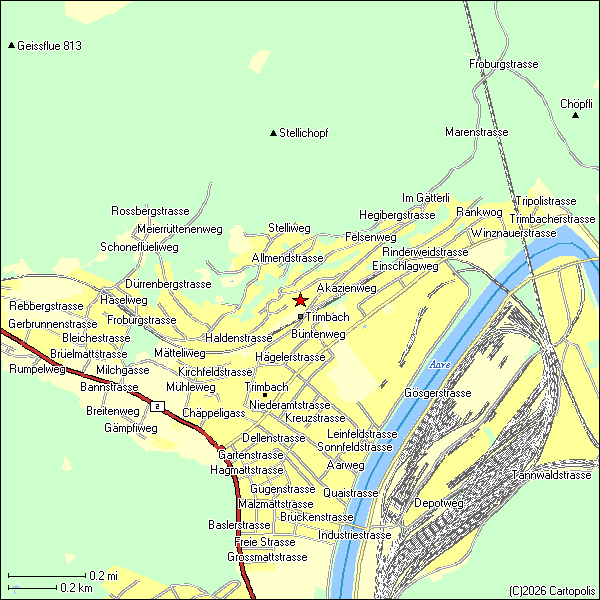
This is not a pixel-perfect reproduction. The differences are as instructive as the similarities.
| MapQuest, 1999 | Cartopolis, 2026 | |
|---|---|---|
| Street labels | rotated along roads | horizontal |
| Scale bar | top-right | bottom-left |
| Palette | 20 colors in this pane; 3 are web-safe | 216-color web-safe |
| Pixel scale | north–south scale ≈16% larger than east–west | square-pixel Web Mercator |
MapQuest rendered on a non-square pixel grid. Fitting its street network against today's OpenStreetMap geometry puts one 1999 pixel at about 4.2 m east–west but 4.9 m north–south: the map is squeezed vertically by roughly 16%. The proportions would be correct at about 38°N — the middle of the continental United States, an ocean away from Trimbach.
Cartopolis is stricter than this MapQuest example in some respects: it limits every color to the web-safe palette, and its square-pixel projection means the single scale bar holds in both axes. It is cruder in others: horizontal labels, more aggressively simplified geometry, and auto-generalized coastlines where 1999 cartographers worked by hand.
Cartopolis supports smooth drag-to-pan with inertia, discrete zoom levels, and offline place and street search, all from static files. With smooth panning, labels are re-placed when the map settles.
A view can be shared through its URL or saved as a GIF, produced by the project's own LZW encoder.
Poster mode renders canvases up to 4000×4000 pixels and exports them at 2× scale: an 8000×8000 web-safe GIF poster. An optional Aerial Photo view shows current swisstopo imagery for comparison.
An offline compiler turns an OpenStreetMap extract into compact binary vector packs. The page fetches only the pieces it needs — HTTP Range requests pull individual byte ranges out of the packs — rasterizes world-aligned tiles in JavaScript, and LZW-encodes the pixels itself. There is no tile server and no database, merely static files that any web host can serve. All of Switzerland is about half a gigabyte.
Lightning-fast modern JavaScript is working hard to impose dial-up-era limits on itself.
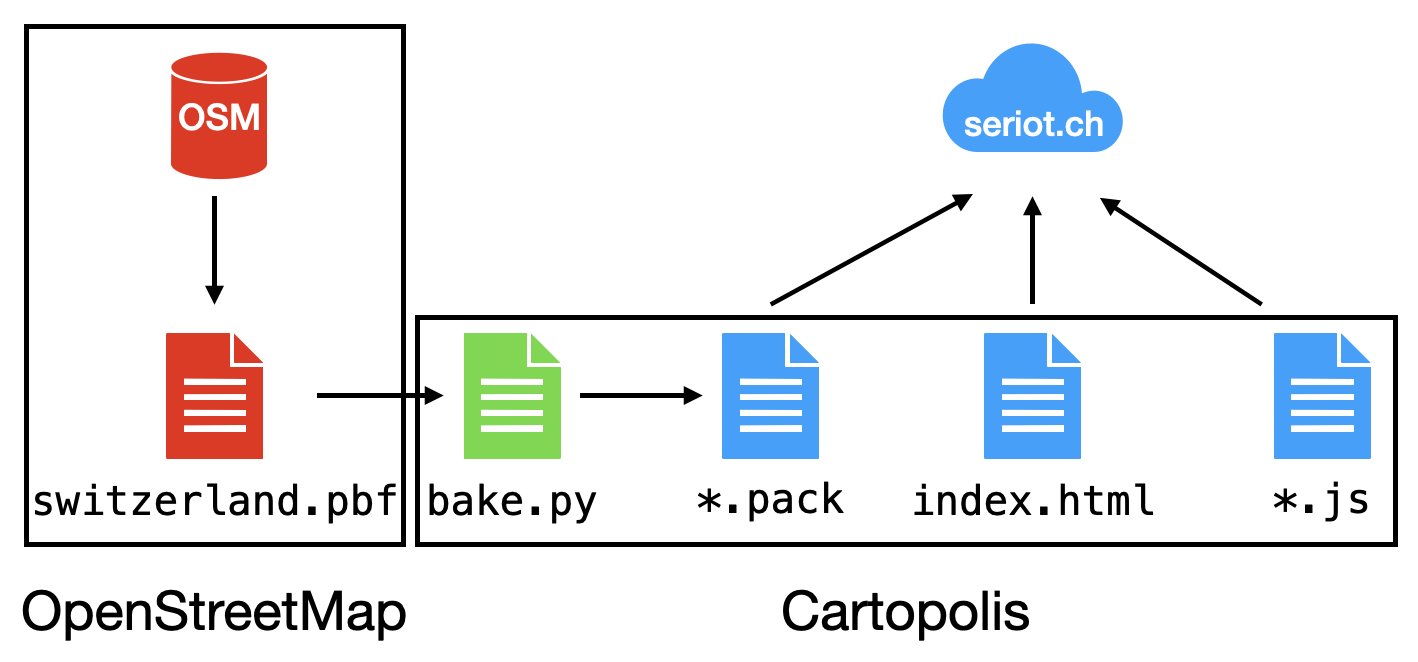
Cartopolis is open source, built with assistance from Claude Code. The compiler is a few files of Python, the renderer a few files of JavaScript. Any Geofabrik extract works. You can bake your own city, region, or country and upload the result to any static host. Full instructions are in the GitHub repository.
Cartopolis shows today's map, dressed like it's still 1999. Three things carried the project:
The reconstruction wins on rigor and loses on craft, but the language survives, and it still reads.
As a mapping service, its practical advantage is deliberately questionable. As an artistic and engineering experiment, less so.
Map: seriot.ch/cartopolis (all of Switzerland, static files)
Source: github.com/nst/Cartopolis
Map data © OpenStreetMap contributors. Aerial imagery © swisstopo.